For decades, IT professional relied on Gpresult /h to validate Group Policy Objects (GPOs). It provided clear, structured HTML reports that made troubleshooting straightforward. But in the modern Intune‑driven endpoint management world, we lacked an equivalent tool—until now.
Microsoft has introduced the IntuneDebug PowerShell module, a purpose‑built solution that generates HTML‑based reports for Intune policies. This bridges the gap between traditional GPO troubleshooting and modern cloud‑based management.
What Is IntuneDebug?
IntuneDebug is a PowerShell tool that helps you understand which Intune policies are applied to a device, how they’re scoped (user vs device), and whether things like apps, scripts, and settings are working as expected.
It’s like having a modern version of Gpresult — but for Intune.
How to Use It (Step-by-Step)
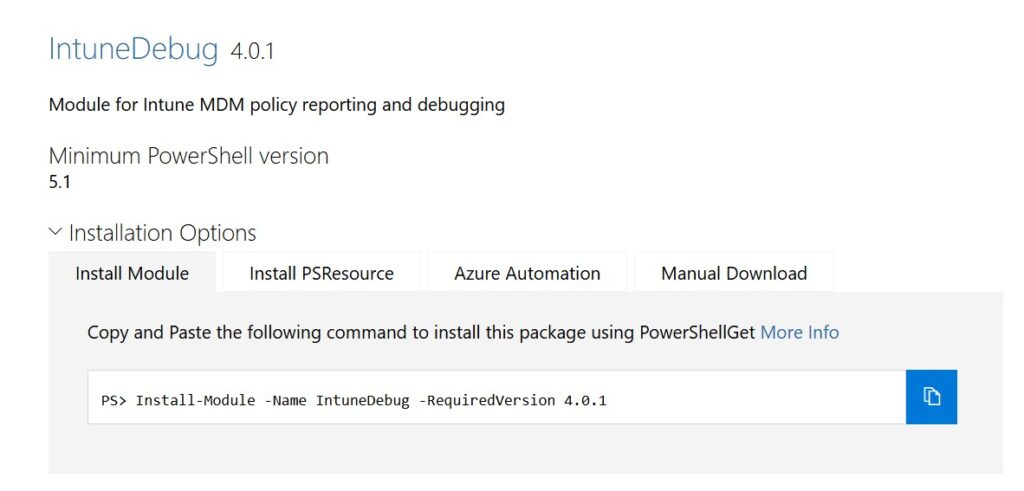
1. Install the Module
Open PowerShell and run:
Install-Module -Name IntuneDebug
This downloads the tool from the PowerShell Gallery.
2. Generate a Report
To create a full HTML report, run:
Get-MDMPolicyReport
This shows you everything Intune is doing on your device — no admin rights needed.
3. Want More Detail?
If you’ve already captured an MDM diagnostic report, you can convert it into a readable format:
Get-MDMPolicyReport -MDMDiagReportPath “C:\Path\To\Report.xml”
Breaking Down the Report Sections
The HTML groups data like Gpresult scopes, with expandable tables and copy buttons for scripts.
DeviceInfo: OS build, last sync time, enrollment ID—spot check-in delays instantly.
PolicyScope: Device: Lists settings by category (Defender, BitLocker). Shows winning provider (MDM), default values, and overrides.
PolicyScope: [User SID/UPN]: User-specific policies per logged-in account. Multi-user devices get separate sections.
EnterpriseDesktopAppManagement: MSI installs with filenames (no policy ID, by design).
Resources: Certificates, firewall rules formatted for quick scan.
Win32Apps (admin only): Detection scripts, install status from IME logs. Copy-paste rules to test locally.
Intune Scripts: Detection/remediation outputs. Get script names via Graph:
LAPS: Local admin password settings and status.
Reference sheet
| Section | Data Source | Admin Needed? | Best For |
| DeviceInfo | MDM XML | No | Sync issues |
| Device Policies | PolicyManager, registry & MDM | No | Conflicts |
| Win32Apps | IME Logs | Yes | App failures |
| Scripts | HealthScripts.log | No | Proactive remediations |
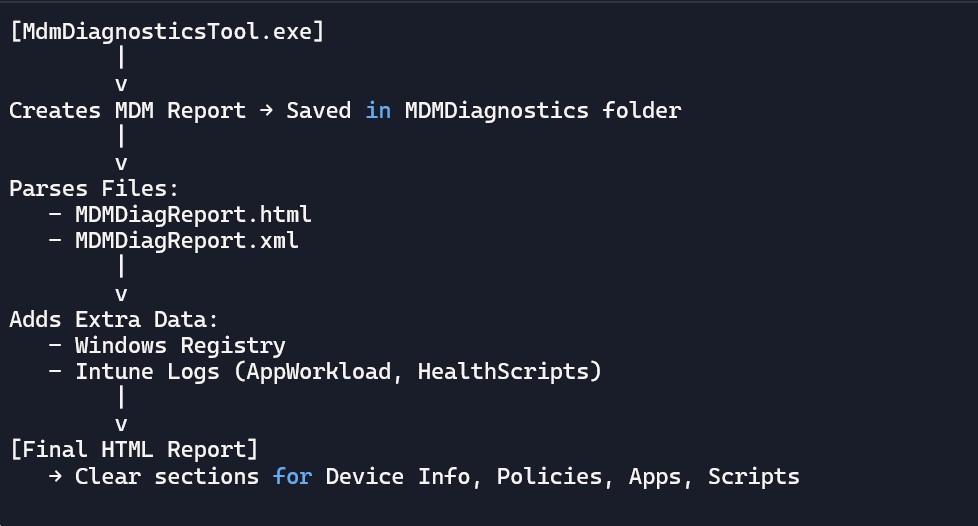
How IntuneDebug Collects and Uses Data
When you run IntuneDebug, it first uses a built‑in Windows tool called MdmDiagnosticsTool.exe to create a report. This report is saved in the folder:
C:\Users\PUBLIC\Documents\MDMDiagnostics. Each report is stored in a new subfolder named with the date and time it was created.
Inside that folder, IntuneDebug looks at two files — MDMDiagReport.html and MDMDiagReport.xml — to pull out the information it needs. These files can be read without administrator rights, which makes it easier for anyone to use.
To make the reports more useful, IntuneDebug also reads some data directly from the Windows registry. In certain cases, administrator permissions are required to access this extra detail. For example, information about Win32Apps and Intune script policies comes from special Intune Management Extension log files located here:
- C:\ProgramData\Microsoft\IntuneManagementExtension\Logs\AppWorkload*.log
- C:\ProgramData\Microsoft\IntuneManagementExtension\Logs\HealthScripts*.log
By default, the diagnostic folders created under C:\Users\PUBLIC\Documents\MDMDiagnostics are automatically deleted once they are older than one day. If you want to keep them longer, you can change this behavior by using the -CleanUpDays parameter and setting it to a higher number.
Why IntuneDebug Beats Manual Troubleshooting
Traditional Gpresult /h showed exactly which GPOs applied to a device or user, with clear sections for settings and conflicts. Intune lacks this built-in, forcing admins to cross-check the troubleshooting pane, registry keys like HKLM\Software\PolicyManager, or raw MDMDiagReport.html files
IntuneDebug automates this by parsing MDM diagnostics, registry data, and IME logs into one readable report. Beginners appreciate no Graph API setup or module dependencies—just run a command. Run it locally (no admin needed for basics) or feed it a captured diagnostics zip from remote devices.
Why This Tool Is Helpful
- No need to dig through logs or registry manually
- Clear, grouped sections make it easy to understand
- Saves time for IT pros, especially when validating compliance or fixing deployment issues
- Great for both beginners and advanced users
It creates an HTML report that shows all applied policies in a clear, organized way. Each section includes extra details from the registry and log files, so you can quickly understand what’s happening and fix issues faster
Practical Use Cases
- Endpoint Managers: Quickly validate Intune compliance across devices.
- IT Architects: Ensure Zero Trust policies are applied correctly.
- Support Teams: Troubleshoot Win32Apps deployment without digging through raw logs.
Limitations and Pro Tips
- Requires PowerShell 5.1 or later
- Elevated permissions unlock deeper insights (Win32Apps status)
- Reports should be stored securely, as they may contain sensitive device information
- Policy IDs don’t reach the endpoint (Intune design), so reports show settings only—no direct profile links.